


I have another article that explains well about monitoring most of
the mikrotik parts via nix base MRTG but it have lots of junk data too ,
curse upon WordPress who always messes with the coding and most of the time my hard work goes to TRASH 

I will post updates
↓
# Enabling SNMP on Mikrotik
First Enable SNMP service (with public as community string or whatever you like on your mikrotik. Make sure no firewall rule is blocking SNMP traffic from/to the monitoring server.Open Terminal in mikrotik and paste the following command. Or you can configure it via going to IP > SNMP
1
2
3
4
5
6
7
| /snmp communityset
[ find default=yes ] addresses=0.0.0.0/0 authentication-password=""
authentication-protocol=MD5 encryption-password=""
encryption-protocol=DES name=public read-access=yes \security=none write-access=no/snmpset
contact=Syed-Jahanzaib enabled=yes engine-id=""
location=aacable-wordpress-com trap-community=public trap-generators=""
trap-target="" trap-version=1[admin@MikroTik-2] /snmp> |

↓
1. Monitoring Mikrotik Simple Queue with Linux base MRTG (for monitoring performance and track purposes)
↓To monitor simple QUEUE via Linux base MRTG, you can use following config as an example

First you have to check your simple queue OID (numeric value which is used by MRTG to poll specific data from the remote server) in mikrotik. for example you have a queue to allow 100M for proxy cached marked packets.

Open Terminal and print OID for Simple Queue number 0 (your can be changed, but in general Queue for proxy hit packets should be on ** TOP ** )
1
2
3
4
5
6
7
| [admin@MikroTik] /queue simple printFlags: X - disabled, I - invalid, D - dynamic0 ;;; Simple Queue for squid Proxy CACHE HIT Packet Allow Unlimited Bandwidthname=SQ-for-cache-hit
interface=all parent=none packet-marks=Cache direction=both priority=8
queue=default-small/default-small limit-at=0/0 max-limit=100M/100M
burst-limit=0/0burst-threshold=0/0 burst-time=0s/0s total-queue=default-small |
1
2
3
4
5
6
7
| [admin@MikroTik] /queue simple print oidFlags: X - disabled, I - invalid, D - dynamic0 ;;; Simple Queue for squid Proxy CACHE HIT Packet Allow Unlimited Bandwidthname=.1.3.6.1.4.1.14988.1.1.2.1.1.2.12534
bytes-in=.1.3.6.1.4.1.14988.1.1.2.1.1.8.12534
bytes-out=.1.3.6.1.4.1.14988.1.1.2.1.1.8.12534
packets-in=.1.3.6.1.4.1.14988.1.1.2.1.1.10.12534packets-out=.1.3.6.1.4.1.14988.1.1.2.1.1.11.12534
queues-in=.1.3.6.1.4.1.14988.1.1.2.1.1.12.12534
queues-out=.1.3.6.1.4.1.14988.1.1.2.1.1.13.12534 |
As showed in the image below . . .

↓
Now we have to take bytes-in and bytes-out value for graphing purposes. which is in our case are
.1.3.6.1.4.1.14988.1.1.2.1.1.8.12534Now you can simply use the below CFG file to create Graphs for the mikrotik simple queue.
.1.3.6.1.4.1.14988.1.1.2.1.1.9.12534
1
2
3
4
5
6
7
8
9
10
11
| Target[mikrotik-simple-queue-in-out]:
.1.3.6.1.4.1.14988.1.1.2.1.1.8.12534&.1.3.6.1.4.1.14988.1.1.2.1.1.9.12534:public@10.0.0.1MaxBytes[mikrotik-simple-queue-in-out]: 100000000#Options[mikrotik-simple-queue-in-out]: bitsTitle[mikrotik-simple-queue-in-out]: Mikrotik QUEUE for Cache HITPageTop[mikrotik-simple-queue-in-out]: <H1>Mikrotik QUEUE for Cache HIT</H1><TABLE><TR><TD>Port:</TD><TD>Connected on WAN router</TD></TR><TR><TD>Maintainer:</TD><TD>Syed Jahanzaib</TD></TR><TR><TD>Interface:</TD><TD>eth0</TD></TR><TR><TD>Max Speed:</TD><TD>10.mbps poor man</TD></TR></TABLE |
↓
SAMPLE GRAPH FOR THE SIMPLE QUEUE MONITORING VIA MRTG
↓ .
..
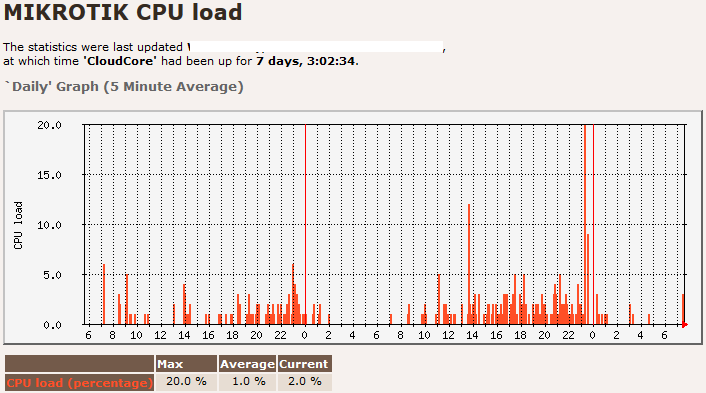
2. Monitoring CPU Usage
1
2
3
4
5
6
7
8
9
10
| ### MIKROTIK 10.0.0.1 CPU load ###Target[10.0.0.1_cpu]: 1.3.6.1.2.1.25.3.3.1.2.1&1.3.6.1.2.1.25.3.3.1.2.1:public@10.0.0.1AbsMax[10.0.0.1_cpu]: 100MaxBytes[10.0.0.1_cpu]: 100Title[10.0.0.1_cpu]: MIKROTIK CPU loadPageTop[10.0.0.1_cpu]: <H1>MIKROTIK CPU load</H1>Options[10.0.0.1_cpu]: gauge,growright,nopercent, nooYLegend[10.0.0.1_cpu]: CPU loadShortLegend[10.0.0.1_cpu]: %LegendI[10.0.0.1_cpu]: CPU load (percentage) |
As showed in the image below . . .
↓
↓
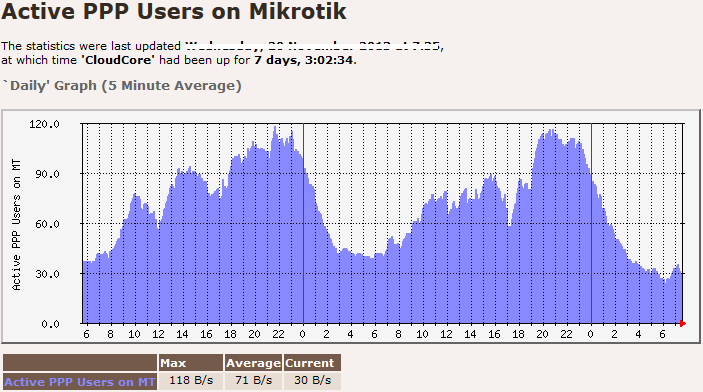
3. Monitoring Active PPP Users
1
2
3
4
5
6
7
8
9
10
11
12
| # Mikrotik PPP ACTIVE UsersTarget[mtpppusers]: 1.3.6.1.4.1.9.9.150.1.1.1.0&1.3.6.1.4.1.9.9.150.1.1.1.0:public@10.0.0.1Title[mtpppusers]: Active PPP Users on MTPageTop[mtpppusers]: <H1>Active PPP Users on MT</H1>MaxBytes[mtpppusers]: 300Colours[mtpppusers]: B#8888ff,B#8888ff,B#5398ff,B#5398ffOptions[mtpppusers]: gauge,nopercent,noo,integer,growrightLegendI[mtpppusers]: Active PPP Users on MTLegendO[mtpppusers]:YLegend[mtpppusers]: Active PPP Users on MTLegend1[mtpppusers]: Active PPP Users on MTLegend2[mtpppusers]: |
As showed in the image below . . .
↓
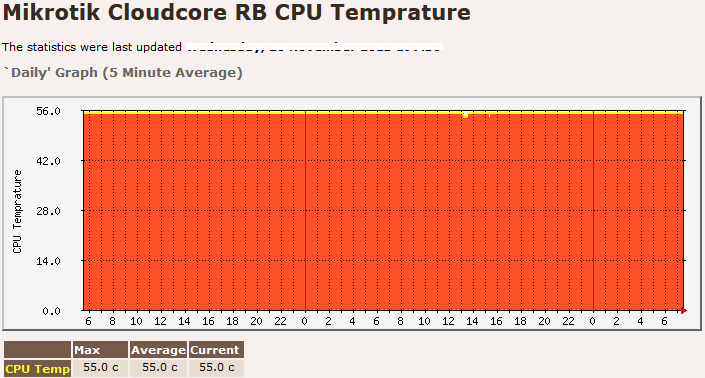
4. Monitoring RB CPU Temperature
1
2
3
4
5
6
7
8
9
10
11
12
13
14
| ### MONITORING Mikrotik CPU TEMP ###Target[mt.cpu.temp]: 1.3.6.1.4.1.14988.1.1.3.11.0&.1.3.6.1.4.1.14988.1.1.3.11.0:public@10.0.0.1Options[mt.cpu.temp]: gauge, growright, nopercent, noinfoMaxBytes[mt.cpu.temp]: 100Colours[mt.cpu.temp]: RED#ff4f27,Y#fffb15,RED#ff4f27,RED#fffb15#Unscaled[mt.cpu.temp]: dwmyYLegend[mt.cpu.temp]: CPU TempratureTitle[mt.cpu.temp]: Mikrotik RB CPU TempraturePageTop[mt.cpu.temp]: <H1>Mikrotik RB CPU Temprature</H1>ShortLegend[mt.cpu.temp]: cLegendI[mt.cpu.temp]:LegendO[mt.cpu.temp]: CPU TempLegend1[mt.cpu.temp]: CPU TempratureLegend2[mt.cpu.temp]: CPU Temprature |
↓
5. Monitoring Routerboard Temperature
1
2
3
4
5
6
7
8
9
10
11
12
13
14
| ### MONITORING Mikrotik RB TEMP ###Target[mt.rb.temp]: 1.3.6.1.4.1.14988.1.1.3.10.0&.1.3.6.1.4.1.14988.1.1.3.10.0:public@10.0.0.1Options[mt.rb.temp]: gauge, growright, nopercent, noinfoMaxBytes[mt.rb.temp]: 100Colours[mt.rb.temp]: RED#ff4f27,Y#fffb15,RED#ff4f27,RED#fffb15#Unscaled[mt.rb.temp]: dwmyYLegend[mt.rb.temp]: RBTempratureTitle[mt.rb.temp]: Mikrotik Router Board TempraturePageTop[mt.rb.temp]: <H1>Mikrotik Router Board Temprature</H1>ShortLegend[mt.rb.temp]: cLegendI[mt.rb.temp]:LegendO[mt.rb.temp]: RB TempLegend1[mt.rb.temp]: RB TempratureLegend2[mt.rb.temp]: RB Temprature |

↓
6. Monitoring Routerboard Voltage
1
2
3
4
5
6
7
8
9
10
11
12
13
14
15
| ### MONITORING Mikrotik VOLTAGE Monitor ###Target[mt-voltage]: .1.3.6.1.4.1.14988.1.1.3.8.0&.1.3.6.1.4.1.14988.1.1.3.8.0:public@10.0.0.1 / 10Options[mt-voltage]: gauge, growright, nopercent, noinfoMaxBytes[mt-voltage]: 1000Colours[mt-voltage]: RED#ff4f27,Y#fffb15,RED#ff4f27,RED#fffb15#Unscaled[mt-voltage]: dwmyYLegend[mt-voltage]: Voltaeg MonitorTitle[mt-voltage]: Mikrotik Cloudcore RB VOLTAGE MonitorPageTop[mt-voltage]: <H1>Mikrotik Cloudcore RB VOLTAGE Monitor</H1>ShortLegend[mt-voltage]: cLegendI[mt-voltage]:LegendO[mt-voltage]: VoltageLegend1[mt-voltage]: VoltageLegend2[mt-voltage]: Voltage |

.
.
Regard’s
Naveed Ahmad


0 comments:
Post a Comment